I hate redundancy. Ever since I was introduced to the world of computer science, I have known that if I ever had to perform the same action multiple times in a row, there was a better way to do it. So, when I realized that I needed to make a series of QlikView charts with the same Y axis but differing X axes, I decided there had to be a better way than doing it by hand. By now I have put in far more time than it would have taken to just do it by hand, but that is irrelevant…
The Problem: Create a dynamic QlikView chart that allows the user to specify the X-axis component.
The Approach: Variables to the rescue!

Pressing Ctrl-Alt-v brings up the Variable Overview window, where I make a few variables to loop through my X-axis choices. The important ones here start with “v_”:
v_sortValues: The list of values to use as Dimensions (X-axis components in QlikView). Note that group names are surrounded by double quotes, while field names are surrounded by single quotes. (This took me a long time to figure out…). [For more on grouped dimensions, go to Chart Properties -> Dimensions -> Edit Groups, and play around with it a bit]
v_sortNames: The human-readable names to associate with the sortValues
v_sortIndex: The currently selected sorting option. Note that QlikView starts indexing at 1 (grrr…)
v_sortMaxIndex: How long our sort arrays are
v_sortSelected: The currently selected option. The ‘Pick’ expression is using v_sortIndex to pick the currently selected v_sortValues. We evaluate this here instead of in the chart because… well, because QlikView likes me better when I do it here. Just trust me. Or don’t, and run your own experiments to find out why!
Now, lets use these variables in a chart.
Create a new chart, and give it a dynamic title. We can use our v_sortNames to synchronize the title with the X-Axis, as long as we start the expression with an “=” and concatenate the string with the expression using “&”.

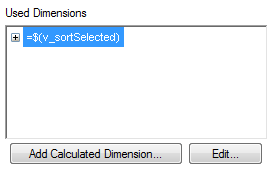
The dynamic X-Axis is even easier… just use our v_sortSelected variable! (in the ‘Dimensions’ tab of the properties table)
Set the Expression to whatever you are trying to calculate.
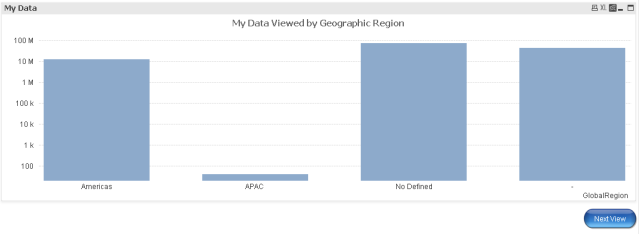
Now, if we set v_sortIndex to 1, we get a beautiful chart like so:

Almost there! Now we just need a way to switch back and forth between our Dimensions. Lets make a button, with some text saying “Next View”. Next, go to the Actions tab and click “Add”. On the left, choose “External”. On the right, choose “Set Variable”. Click “okay”, then select v_sortIndex as the variable to change. Give it a value of =If($(v_sortIndex) < $(v_sortMaxIndex), $(v_sortIndex) + 1, 1), so that it will loop 1 through v_sortMaxIndex. Give your button a click, and watch what happens!
Yay!! Multiple views in one graph!! Keep clicking in delight, and watch the graphs load over and over. The most fun you’ve had all night, right? 😉

Pingback: QlikView VB Scripting For Newbies | denvercoder9
Feeling so proud of myself… my first answer to a forum post!
Why have not you used a cyclic group as a dimension?
I have played with cyclic groups as well, but the dimensions I wanted here were each drill-down groups. As far as I could tell, QlikView won’t let you let you mix the two.
If you want to adapt this to create a chart that can cycle through different values e.g. =sum($(vChart_Val)) as an expression as well then make sure that the field names stored in your variables are either unquoted or wrapped in square brackets. chr(91) and chr(93) will give you access to the square brackets if you need to wrap them dynamically, e.g. =chr(91) & vChart_Dim & chr(93)
thank you! – remarkably difficult information to find. I’ve adapted your technique to great success – owe you beer 😀
You just made my day!!! I Second Bill.. Great information!
Will it work if i wanna do the same for y-axis?
I believe it should. I don’t remember if you can have this work for both axis at the same time, but I don’t see why not.
Thanks for one’s marvelous posting! I genuinely enjoyed reading it, you happen to be a great author.I will ensure that I bookmark your blog and will eventually come back someday. I want to encourage that you continue your great work, have a nice weekend!
When someone writes an post he/she keeps the idea of a user in his/her
brain that how a user can understand it. So that’s why this piece of writing is amazing. Thanks!
Hello!
I just wanted to say THANKS for the nice Qlikview tips … I’ve been trying to find how to switch axis dynamically (without cyclic groups) for many days now and followed exactly what you said and it WORKED.
Sir, you are the man of the day and probably the man of the week.
Cheers and I owe you a beer,
Richard